 01
01
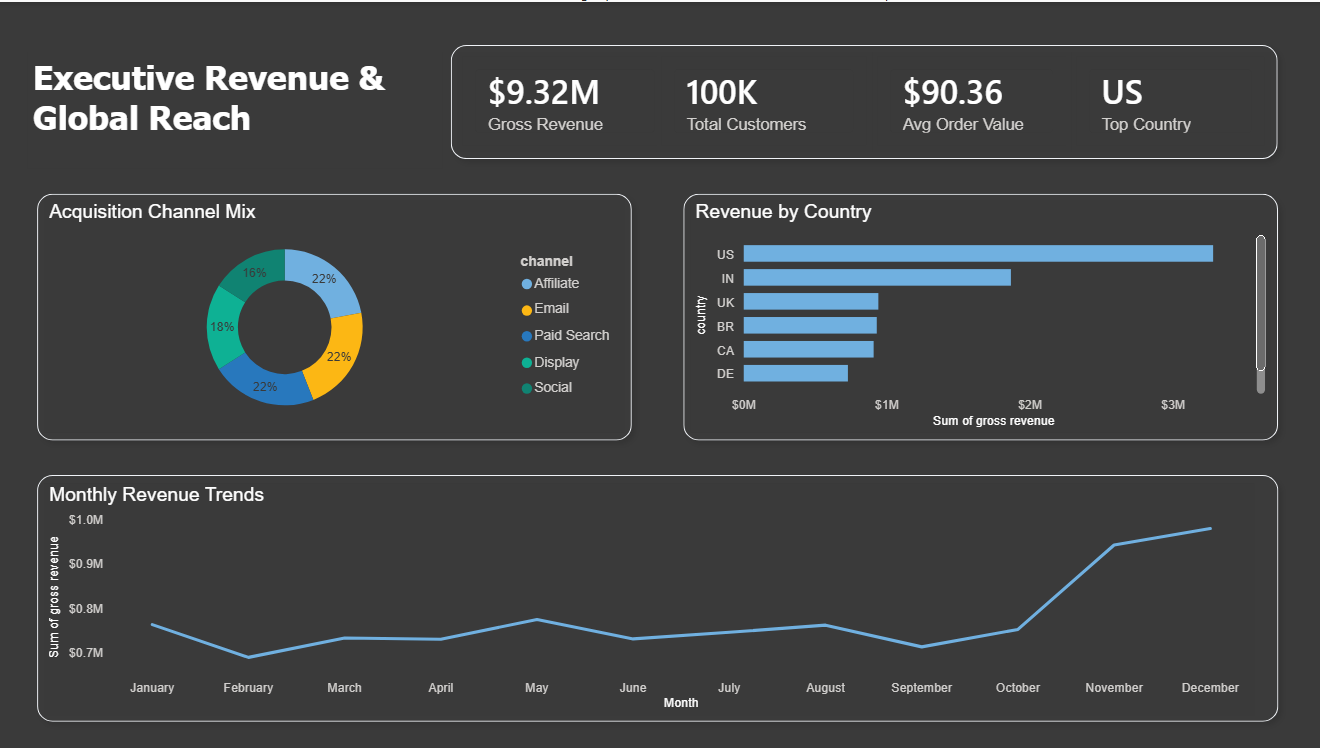
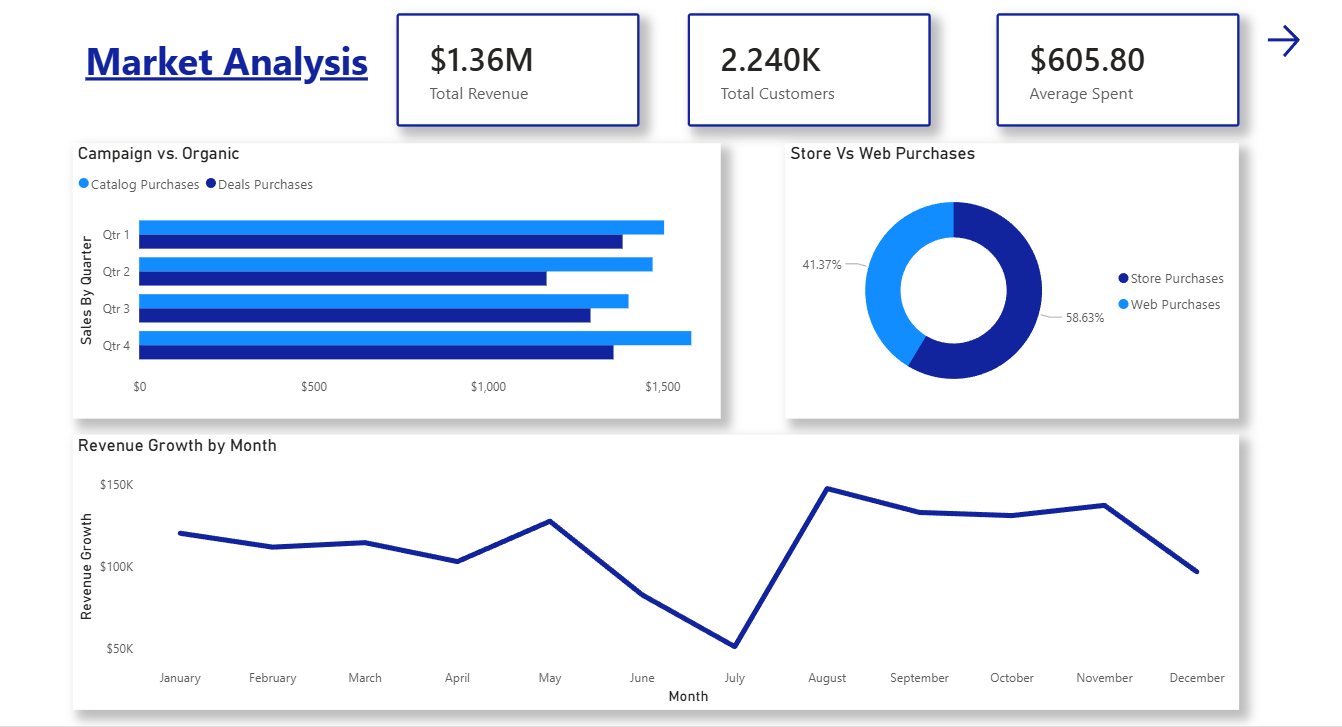
Marketing Performance & Campaign ROI Analysis
Built an end-to-end ETL pipeline using Python and SQL to consolidate raw marketing spend, impression, and revenue data into a single Power BI model. The final dashboard gave stakeholders a clear view of which campaigns were generating profitable returns and which were burning budget without conversion.
✓
Engineered ETL pipeline converting raw multi-source data into a clean analytical model
✓
Identified highest and lowest ROI campaigns across channels, enabling budget reallocation
✓
Delivered interactive Power BI dashboard with drill-through by channel, campaign, and period